The new Clinical Governance profile on Dashboard of the Greiner Bio-One eTrack aims to evaluate the quality of the services provided from a clinical perspective, allowing a better analysis of the processes and results of the procedures performed.
In the profile Clinical Governance we have the following graphs of indicators:
- Average collection time per Operator/Day
- Efficiency by collector
- Satisfaction Survey/Day
- Average time per patient
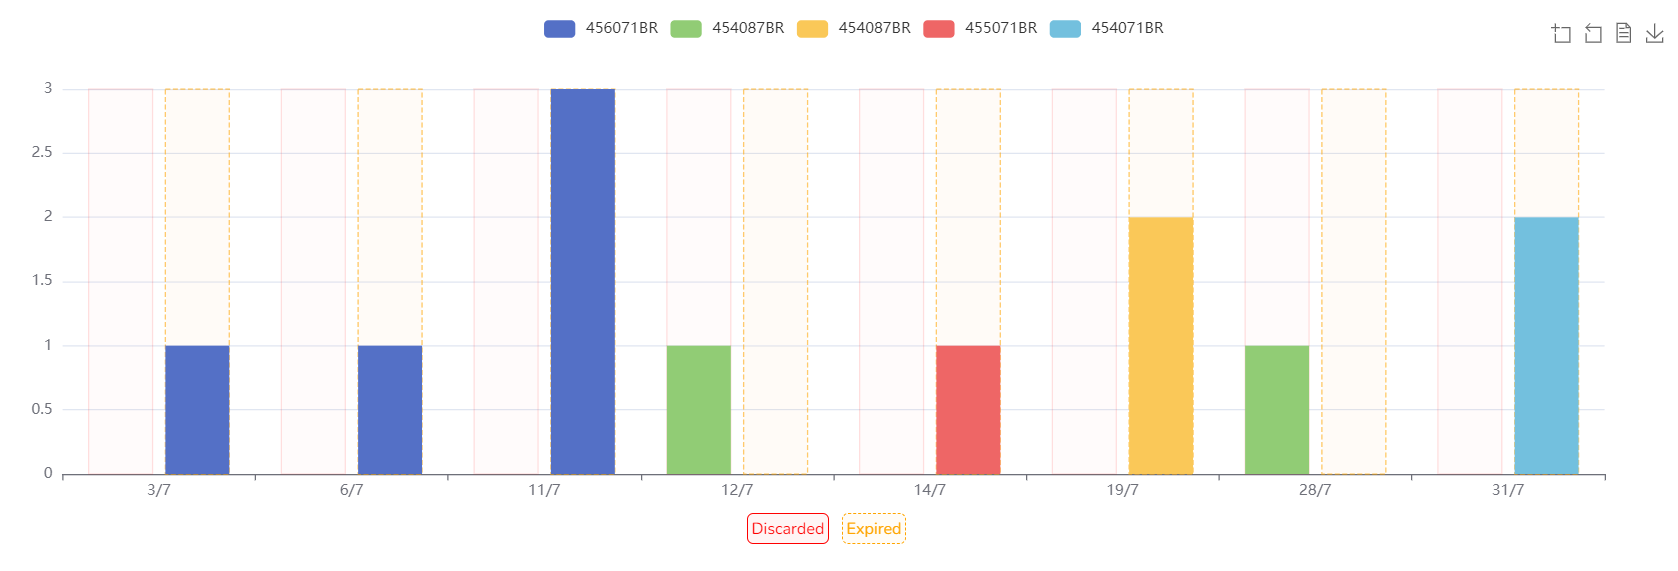
- Number of adverse effects (new)
This chart considers discarded and expired materials in the selected period
- Transparency in processes and interpersonal relationships (new)
This chart shows the intersection of customer ratings per collector with the average collection time per collector over the selected period.
Try our Greiner Bio-One eTrack app right now and find out how it can help your laboratory routine.