Episódio 1 – Quando o erro nasce no cadastro e morre no setor técnico No papel, o cadastro de paciente é “rotina simples”.Na prática, é o lugar perfeito para plantar um erro que só vai explodir horas depois, lá dentro do setor técnico, na forma de exame refeito, laudo atrasado e discussão entre equipes. O […]
Tag Archives: produtividade
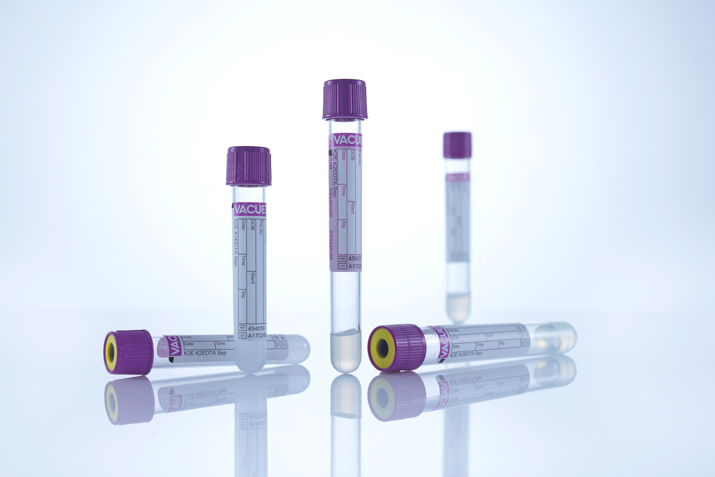
Detalhes dos Tubos de EDTA VACUETTE® Os tubos de EDTA são a primeira escolha para a maioria das análises hematológicas de rotina. Sua principal função é anticoagular o sangue total, preservando ao mesmo tempo a morfologia e a integridade das células sanguíneas (hemácias, leucócitos e plaquetas), o que é essencial para contagens e análises microscópicas. […]
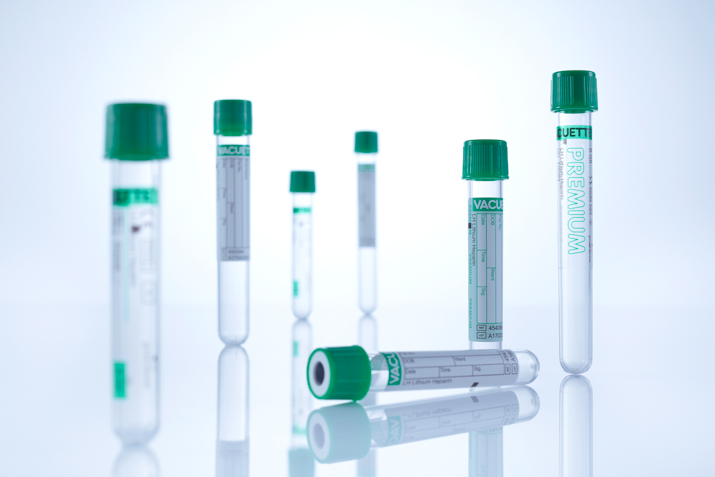
Tubos de Heparina da linha VACUETTE® Detalhes dos tubos de heparina VACUETTE® Os tubos de heparina são utilizados para a obtenção de amostras de plasma, destinadas principalmente a análises de bioquímica clínica. São a escolha ideal para testes que requerem uma análise rápida (urgências ou “STAT”), pois não é necessário aguardar o tempo de formação […]
Tubos para Tipagem Sanguínea VACUETTE® Estes tubos são projetados especificamente para a coleta de sangue destinado à determinação de grupos sanguíneos (tipagem ABO e Rh) e para aplicações que exigem a preservação da viabilidade e integridade das células sanguíneas, especialmente das hemácias, por um período prolongado. Aditivos e Mecanismo de Ação A eficácia desses tubos […]
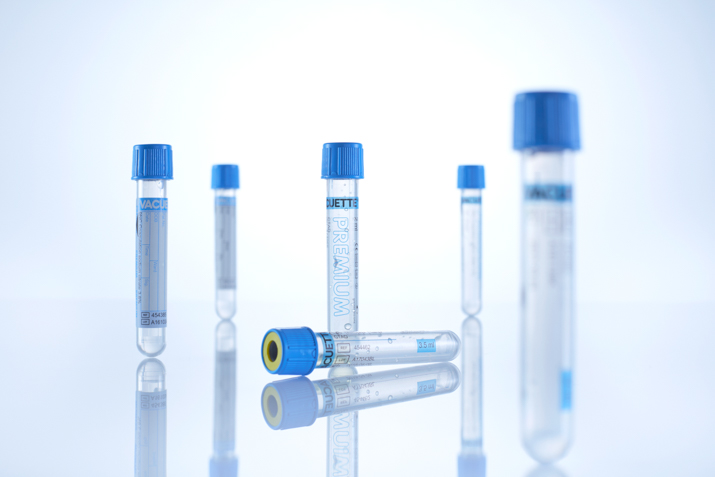
O Papel fundamental do tubo azul claro (Citrato) VACUETTE® Tanto os tubos de coagulação padrão quanto os tubos CTAD são utilizados para coletar sangue destinado a análises que avaliam a cascata de coagulação. Esses testes são cruciais para o diagnóstico de distúrbios hemorrágicos, monitoramento de terapias anticoagulantes e avaliação do risco de trombose. 1. Tubos […]
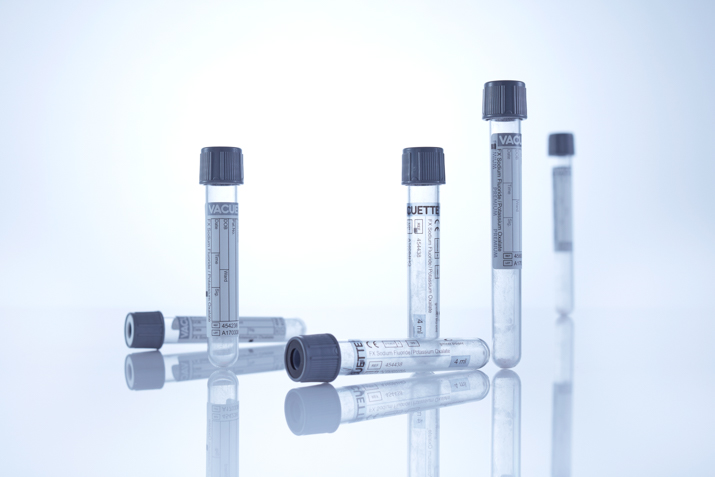
Estabilidade garantida: Por que usamos o tubo cinza para glicose e lactato? O tubo cinza para glicemia da linha VACUETTE® da Greiner Bio-One é um componente crucial para a precisão diagnóstica em testes de glicose e lactato. Sua composição é projetada especificamente para prevenir a degradação da glicose no sangue após a coleta. Detalhes do […]
Se um laboratório tem um custo de R$8,00 com desperdício a cada 1.000 coletas e realiza 20.000 coletas por mês, quanto dinheiro está sendo perdido em um ano? A resposta – R$1.920,00 – pode parecer pequena à primeira vista, mas revela a ponta de um iceberg de ineficiência que corrói silenciosamente a rentabilidade e a […]
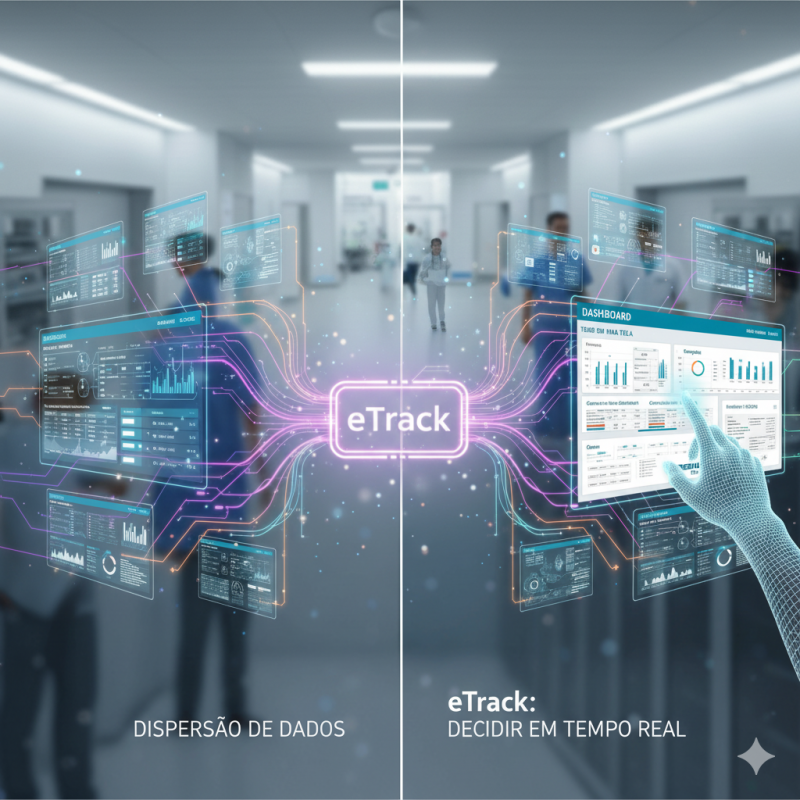
Um coordenador de logística hospitalar perde de 30 a 90 segundos por decisão ao alternar entre diferentes telas e relatórios para rastrear uma única amostra ou transporte de paciente. Em um plantão de 12 horas, quantas decisões são adiadas? E qual o custo desse atraso no Tempo Total do Exame (TAT)? Este não é um […]
Nos últimos meses, eu tenho repetido uma frase dentro da Greiner e com clientes: o problema não é falta de dados; é excesso de dados mal organizados. A inteligência artificial (IA — “um cérebro digital que aprende com exemplos”) está transformando o mercado justamente porque troca “opinião + feeling” por padrões reais que aparecem no […]
Integração eTrack No meu dia a dia de pré-analítico, vejo a mesma cena se repetir: os sistemas até “existem”, mas não se falam direito. A decisão atrasa, a equipe improvisa, o paciente sente. Antes de falar de solução bonita, quero expor onde está o problema: Onde está o atrito (e o que te faz perder […]

